Chatham-Kent Association of REALTORS® MLS® home sales still seeing strong monthly trends in May
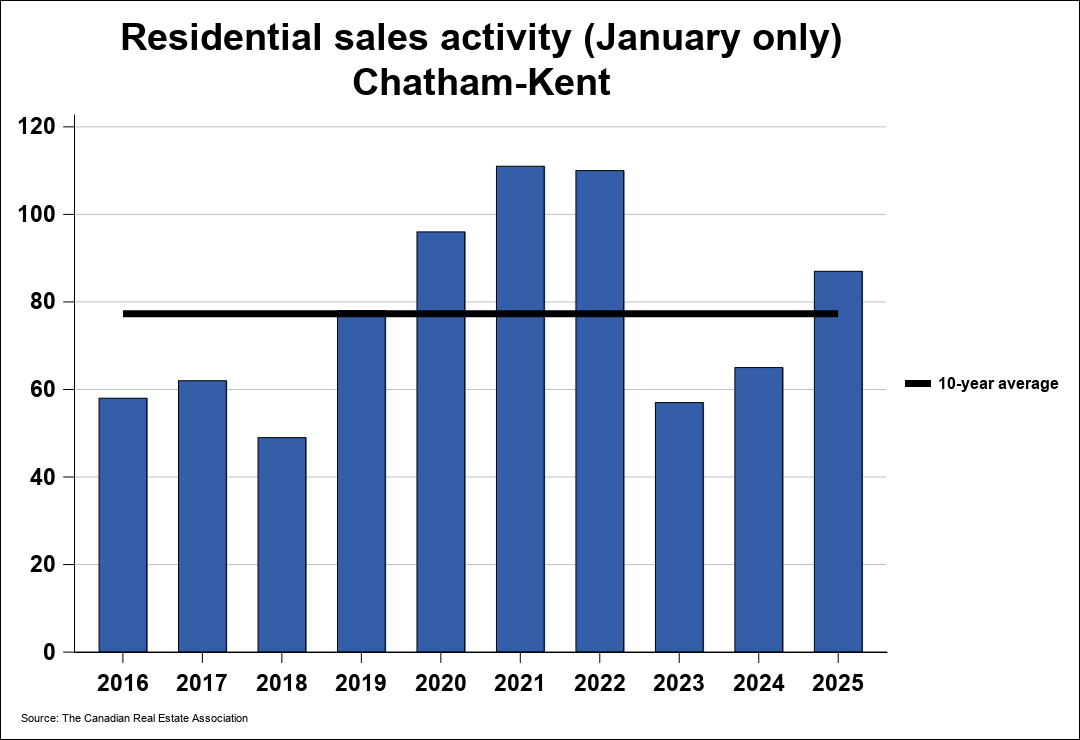
The number of homes sold through the MLS® System of the Chatham-Kent Association of REALTORS® totaled 123 units in May 2026. This was a substantial decline of 17.4% from May 2025.
Home sales were 8.6% below the five-year average and 13.4% below the 10-year average for the month of May.
On a year-to-date basis, home sales totaled 478 units over the first five months of the year. This was a modest decline of 3.8% from the same period in 2025.
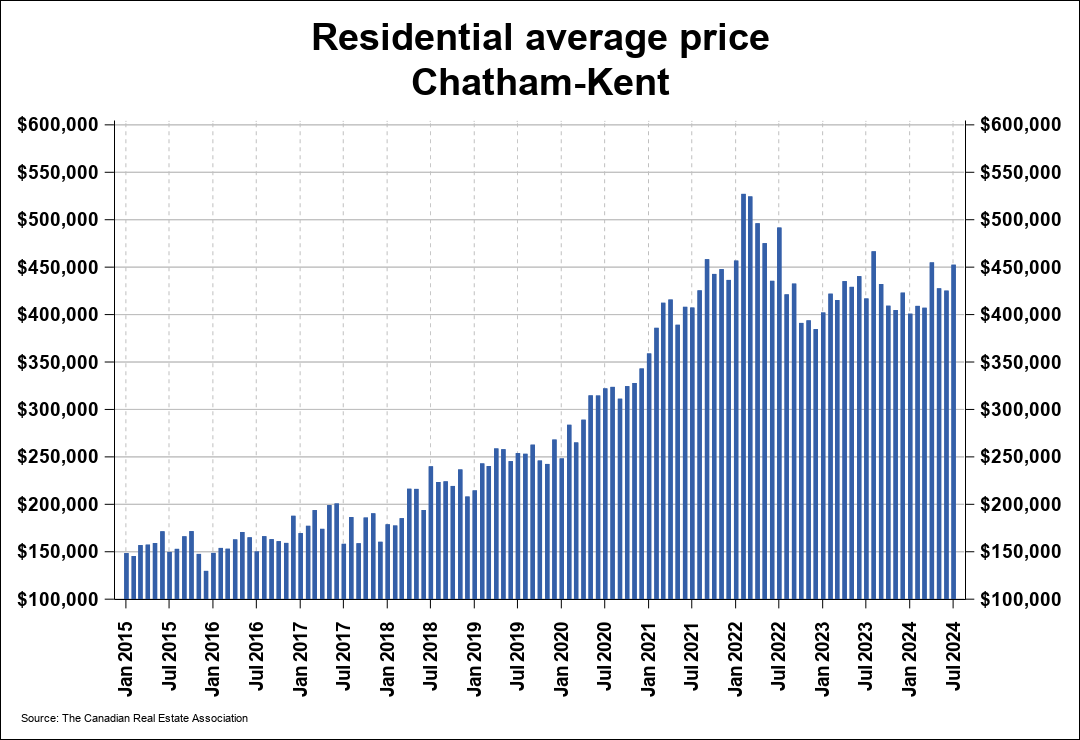
“Sales activity declined on a year-over-year basis but we’re still seeing strong monthly trends, especially after demand bottomed out at the beginning of the year,” said Carrie Patrick, President of the Chatham-Kent Association of REALTORS®. “Sellers are out in greater force than ever, posting more than 300 new listings for the first time in any May. This was also the third highest new listings count on record behind last month and June 2025. Prices have been moving sideways for a few years now, with some volatility in between, and the market is tilted in favour of buyers, so this would be an excellent time to get into or re-enter the market for those seeking a new place to call home.”
The MLS® Home Price Index (HPI) tracks price trends far more accurately than is possible using average or median price measures. The overall MLS® HPI composite/single-family benchmark price was $402,500 in May 2026, falling by 1.3% compared to May 2025.
The average price of homes sold in May 2026 was $449,553, up modestly by 3.5% from May 2025.
The more comprehensive year-to-date average price was $440,093, a minor increase of 1.7% from the first five months of 2025.
The dollar value of all home sales in May 2026 was $55.3 million, a big reduction of 14.6% from the same month in 2025.
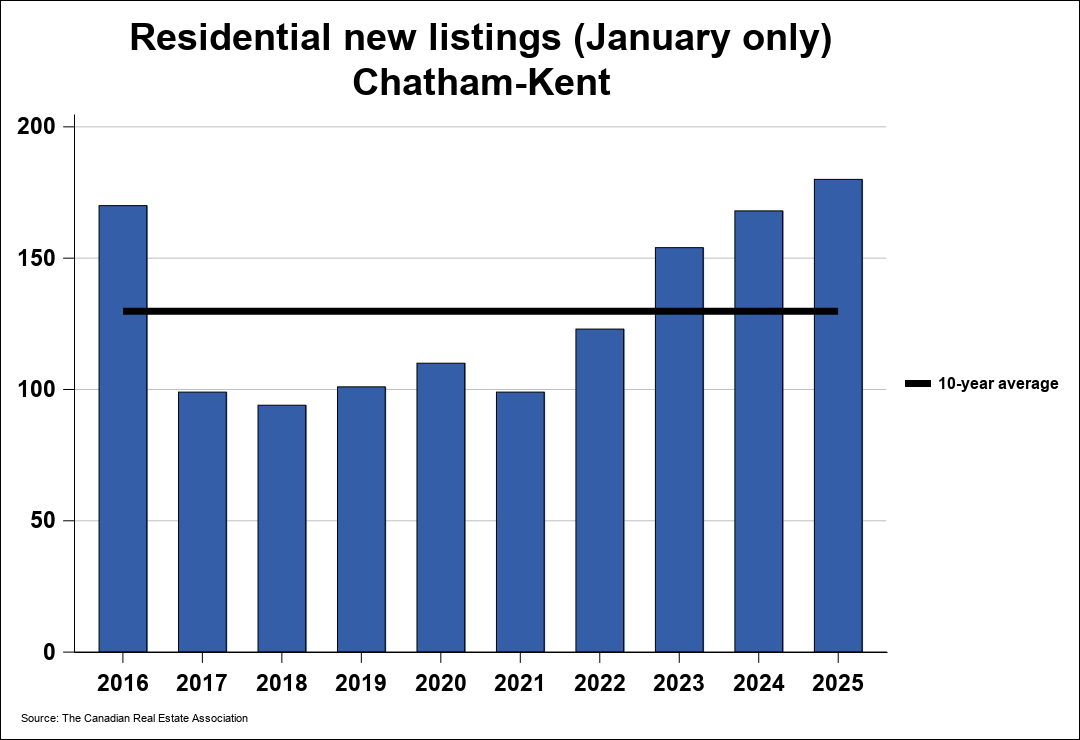
The number of new listings was up by 11.8% from May 2025. There were 313 new residential listings in May 2026. This was also the largest number of new listings added in the month of May in history.
New listings were 11.6% above the five-year average and 29.5% above the 10-year average for the month of May.
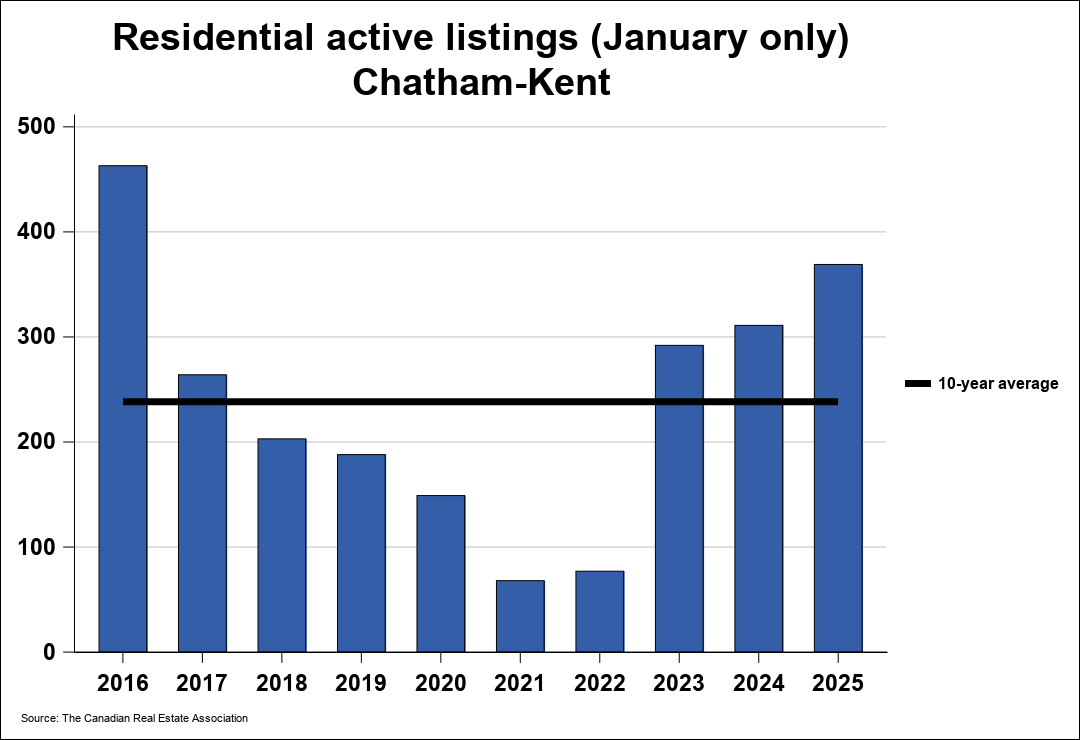
Active residential listings numbered 563 units on the market at the end of May, a gain of 11% from the end of May 2025. Active listings haven’t been this high in the month of May in more than a decade.
Active listings were 31.4% above the five-year average and 69.1% above the 10-year average for the month of May.
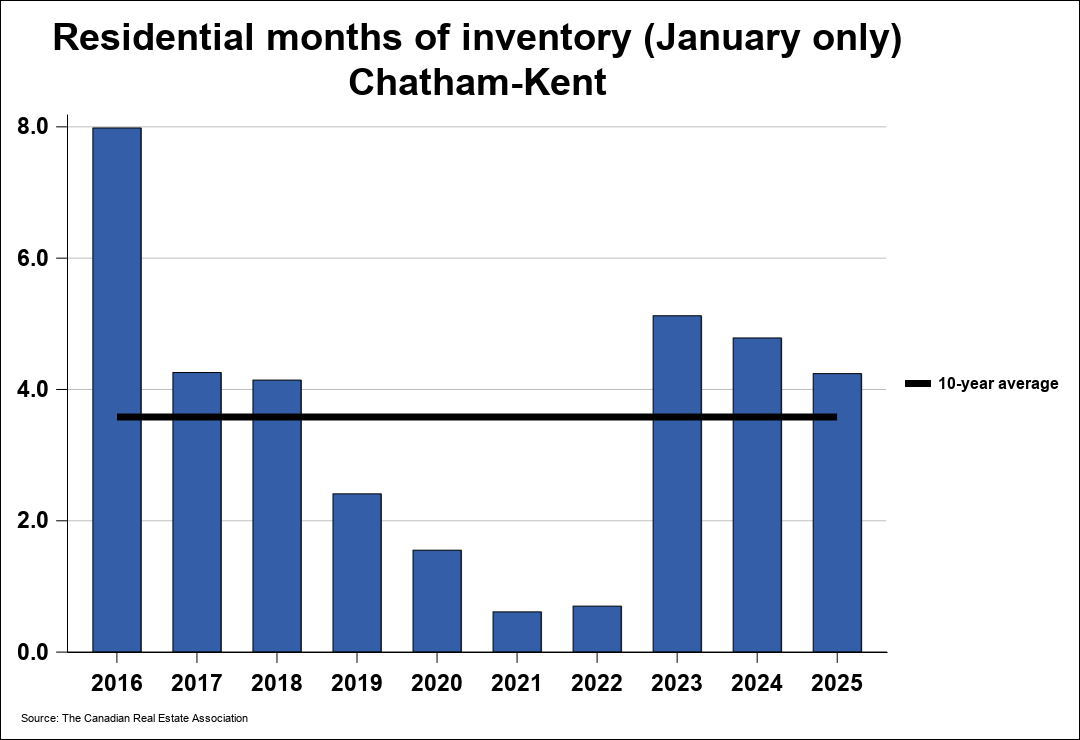
Months of inventory numbered 4.6 at the end of May 2026, up from the 3.4 months recorded at the end of May 2025 and above the long-run average of 2.4 months for this time of year. The number of months of inventory is the number of months it would take to sell current inventories at the current rate of sales activity.
| Percentage change compared to | |||||||
|---|---|---|---|---|---|---|---|
| Monthly | May 2026 | May 2025 | May 2024 | May 2023 | May 2021 | May 2019 | May 2016 |
| Sales Activity | 123 | -17.4% | 5.1% | -10.2% | -32.0% | -24.1% | -25.9% |
| Average Price | $449,553 | 3.5% | 5.1% | 4.7% | 15.5% | 74.2% | 163.2% |
| Dollar Volume* | $55.3 | -14.6% | 10.5% | -6.0% | -21.5% | 32.3% | 95.0% |
| New Listings | 313 | 11.8% | 15.9% | 15.9% | 29.9% | 34.9% | 42.9% |
| Active Listings | 563 | 11.0% | 18.0% | 50.1% | 245.4% | 94.1% | 12.4% |
| Percentage change compared to | |||||||
|---|---|---|---|---|---|---|---|
| Year-to-date | May 2026 YTD | May 2025 YTD | May 2024 YTD | May 2023 YTD | May 2021 YTD | May 2019 YTD | May 2016 YTD |
| Sales Activity | 478 | -3.8% | -2.6% | -4.8% | -36.2% | -9.6% | -15.7% |
| Average Price | $440,093 | 1.7% | 4.0% | 3.8% | 11.2% | 78.7% | 174.4% |
| Dollar Volume* | $210.4 | -2.2% | 1.2% | -1.1% | -29.0% | 61.4% | 131.3% |
| New Listings | 1,209 | 6.7% | 9.0% | 20.8% | 31.1% | 52.7% | 26.6% |
| Active Listings** | 457 | 6.4% | 15.6% | 38.3% | 338.8% | 105.6% | -6.2% |
| Legend |
|---|
| * In millions of dollars |
| ** The year-to-date active listings figure is a monthly average of the number of homes on the market at the end of each month so far this year |
BOARD & ASSOCIATION INFORMATION
The Chatham-Kent Association of REALTORS® represents 200+ REALTORS® registered with its member offices. The geographical area served by the Board is the municipality of Chatham-Kent in the heart of southwestern Ontario.

CHATHAM-KENT ASSOCIATION OF REALTORS®
Visit external site
For more information,
please contact:
- 519-352-4351
- info@ckar.ca

Carrie Patrick


