Canadian Home Sales Up Again in June, National Prices Holding Steady
Monthly Housing Market Report
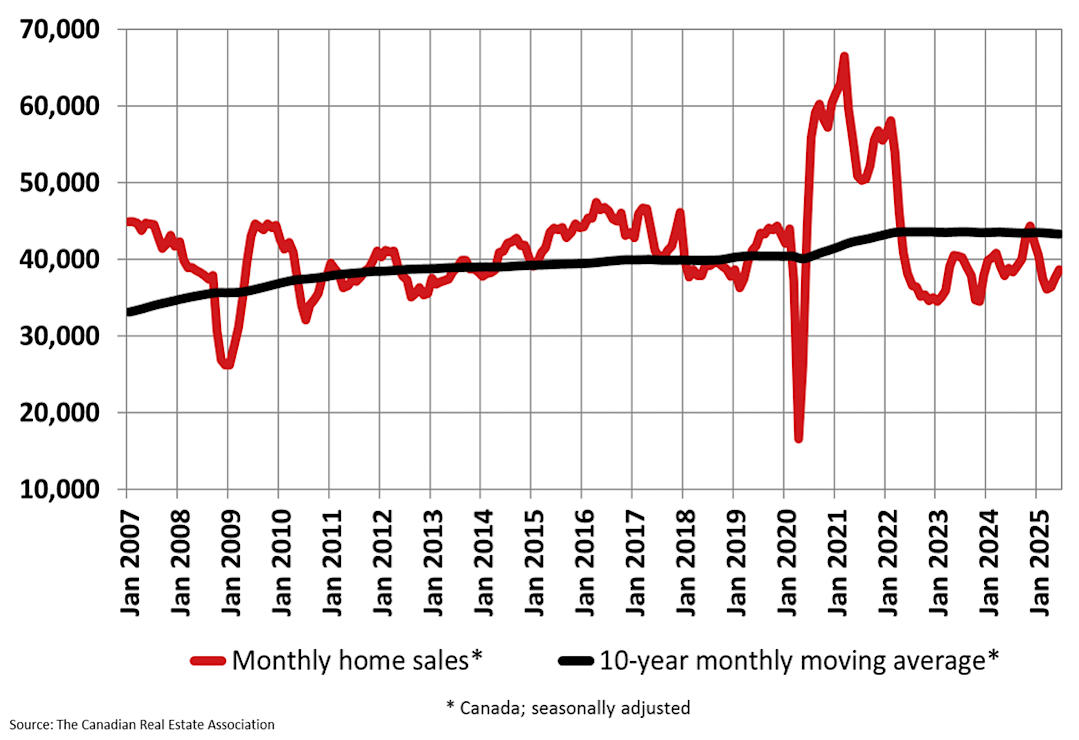
Ottawa, ON July 15, 2025 – The number of home sales recorded over Canadian MLS® Systems rose 2.8% on a month-over-month basis in June 2025, building on the 3.5% gain recorded in May. (Chart A)
Over the past two months, the recovery in sales activity was led overwhelmingly by the Greater Toronto Area (GTA), where transactions, while remaining historically low, have rebounded a cumulative 17.3% since April.
“At the national level, June was pretty close to a carbon copy of May, with sales up about 3% on a month-over-month basis and prices once again holding steady,” said Shaun Cathcart, CREA’s Senior Economist. “It’s another month of data suggesting the anticipated rebound in Canadian housing markets may have only been delayed by a few months, following a chaotic start to the year; although with the latest 35% tariff threat, we’re not out of the woods yet.”
June Highlights:
National home sales were up 2.8% month-over-month.
Actual (not seasonally adjusted) monthly activity came in 3.5% above June 2024.
The number of newly listed properties fell 2.9% on a month-over-month basis.
The MLS® Home Price Index (HPI) was almost unchanged (-0.2%) month-over-month and was down 3.7% on a year-over-year basis.
The actual (not seasonally adjusted) national average sale price was down 1.3% on a year-over-year basis.

Chart A
New supply declined by 2.9% month-over-month in June. With sales up and new listings down, the national sales-to-new-listings ratio rose to 50.1%, up from 47.3% in May. The long-term average for the national sales-to-new listings ratio is 54.9%, with readings between 45% and 65% generally consistent with balanced housing market conditions.
There were 206,435 properties listed for sale on Canadian MLS® Systems at the end of June 2025, up 11.4% year-over-year and just 1% below the long-term average for that time of the year.
“Most housing markets continued to turn a corner in June, although market conditions still vary considerably depending on where you are in Canada,” said Valérie Paquin, CREA Chair. “If the spring market was mostly held back by economic uncertainty, barring any further big shocks, that delayed activity could very likely surface this summer and into the fall. If you’re looking to buy or sell a property in the second half of 2025, start planning with a REALTOR® in your area today.”
There were 4.7 months of inventory on a national basis at the end of June 2025, dipping slightly below the long-term average of five months of inventory. Based on one standard deviation above and below that long-term average, a seller’s market would be below 3.6 months and a buyer’s market would be above 6.4 months.
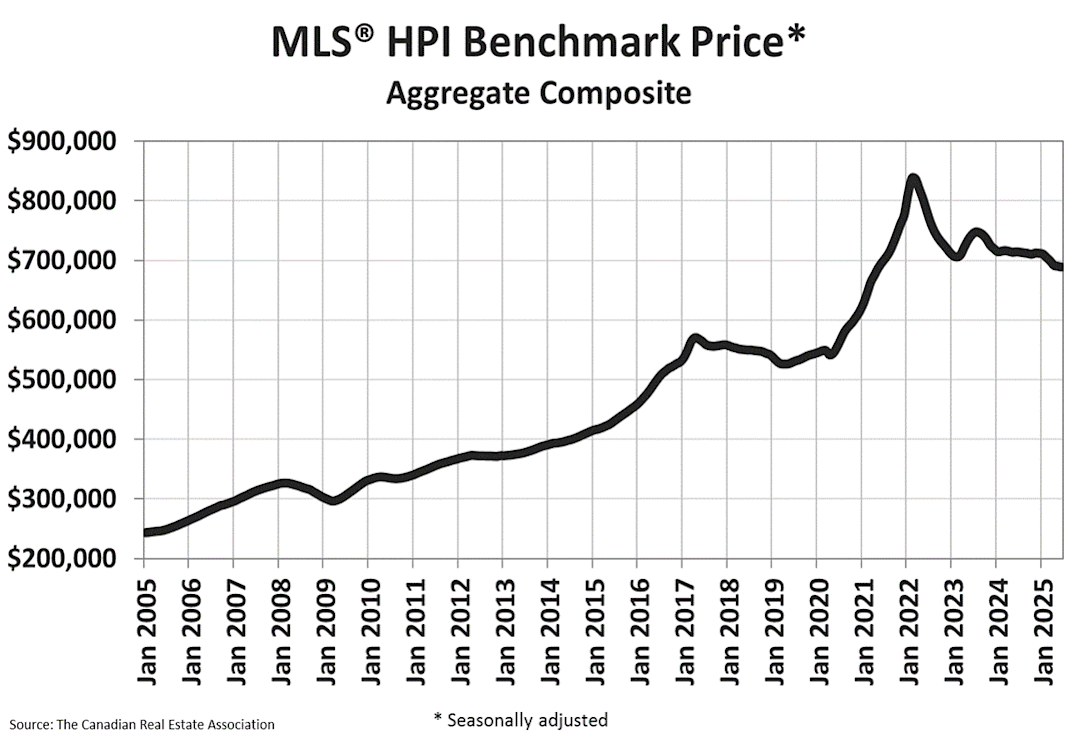
The National Composite MLS® Home Price Index (HPI) was little changed (-0.2%) from May to June 2025, following three straight month-over-month declines of closer to 1% in February, March, and April.
The non-seasonally adjusted National Composite MLS® HPI was down 3.7% compared to June 2024. Based on the extent to which prices fell off in the second half of 2024, expect year-over-year declines to shrink in the months ahead. (Chart B)

Chart B
The non-seasonally adjusted national average home price was $691,643 in June 2025, down 1.3% from June 2024.
The next CREA statistics package will be published on Friday, August 15, 2025.


